Player statistics
How to Read Chess Rating Trends Without Misleading Yourself
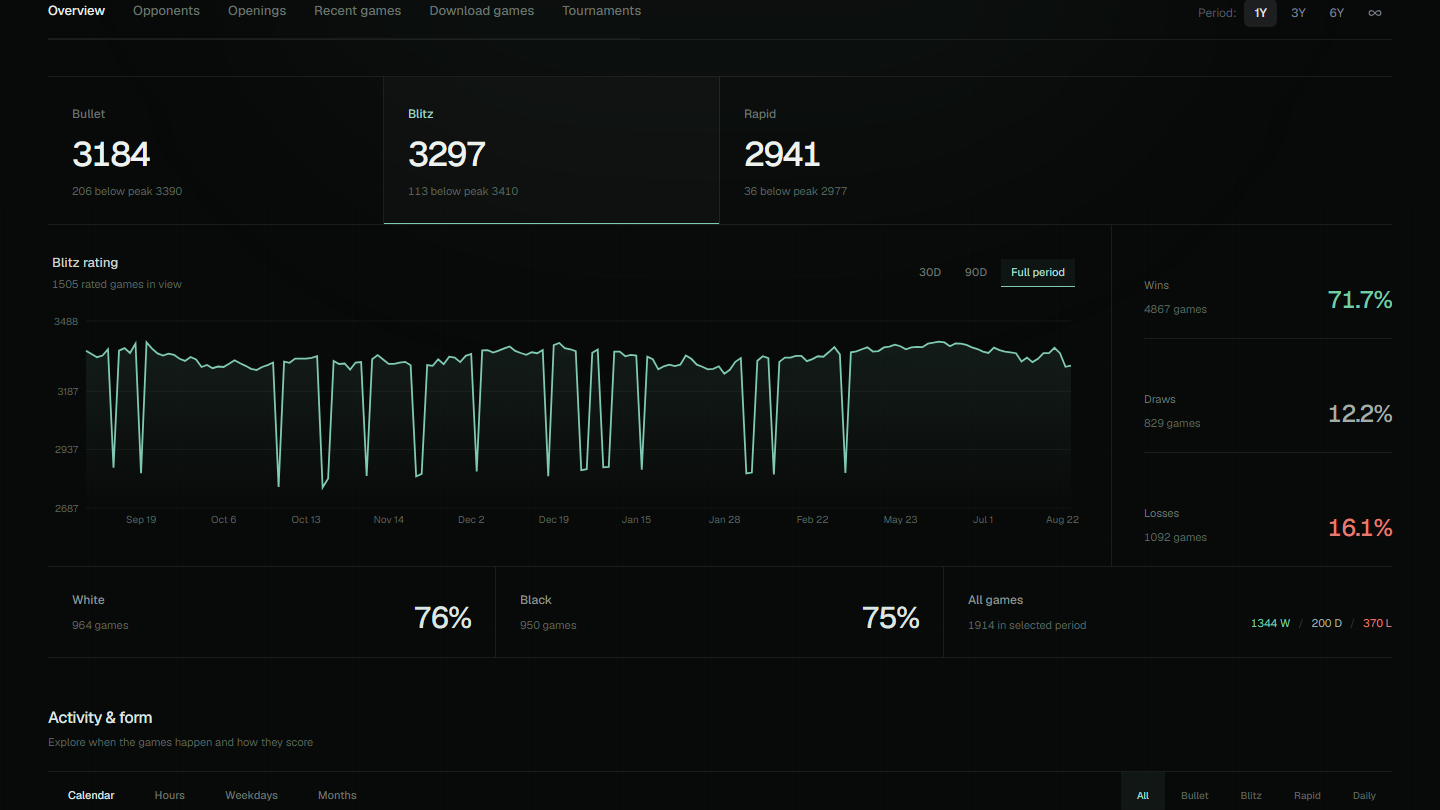
A rating line is easy to read and easy to overinterpret. A useful conclusion connects direction to format, volume, opponents, and the games behind the movement.
By Norbert Jakubiak · · 8 min read
Keep every time control separate
Bullet, blitz, rapid, and daily ratings describe different competitive environments. They differ in pace, player pool, decision quality, and often in how frequently someone plays. Select one format before reading the chart.
If rapid is flat while blitz rises, the evidence supports a blitz trend. It does not support a general claim that the player improved equally everywhere.
Read direction together with game volume
A change over five games is not equivalent to the same change over fifty. Use the rated-game count and activity view to see whether the line represents sustained play, one intense session, or a small return-to-play sample.
Also distinguish a new peak from a stable level. Reaching a rating once shows capability. Maintaining results around that level across many sessions is stronger evidence that the player's baseline changed.
- Ask how many games created the movement.
- Check whether it persisted across several sessions.
- Look for inactive gaps before comparing endpoints.
- Treat short streaks as prompts for review, not final conclusions.
Mark the turning points
Use the range controls to isolate a rise, decline, or plateau. Note where the movement begins and where it stabilizes. You now have a review window rather than a vague impression from the full chart.
Abrupt isolated drops deserve extra caution. They can reflect a short losing session, sparse archive coverage, or a temporary change in opposition. A smoother movement across many dates usually carries more analytical weight.
Add results, color, and opponent strength
Win rate alone is not enough. A strong score against lower-rated opposition and an even score against higher-rated opposition describe different performances. Check recent opponents and the rating difference in representative games.
The White and Black split adds another useful question. If one side drives most of the decline, move to Openings and inspect the relevant repertoire. Confirm whether the difference survives a reasonable sample before calling it a weakness.
Open games around the movement
Select games immediately before, during, and after the turning point. Look for changes in opening choice, playing frequency, opponent group, game length, and repeated tactical or strategic errors.
A chart can show correlation. The games let you test a chess explanation. If the losses are unrelated, the honest conclusion may be that the rating movement reflects normal variance rather than one repeatable weakness.
- Two games before the movement.
- Three representative games inside it.
- Two games after the line stabilizes.
- At least one win to compare with the losses.
Write a cautious conclusion that leads to action
A strong conclusion states what changed, where it changed, and how reliable the evidence is. For example: 'Blitz results improved across a substantial recent sample, while rapid activity is too limited to judge.'
Then attach a next step. Review Black openings from the start of a decline, compare wins before and after a recovery, or analyze the recurring positions in the longest losing sessions. Chess Scanner organizes the evidence; the final claim should remain proportional to it.